Implied Orderblock Breaker (Zeiierman)█ Overview
The Implied Order Block Breaker (Zeiierman) is a tool designed to identify enhanced order blocks with imbalances. These enhanced order blocks represent areas where there is a rapid price movement. Essentially, this indicator uses order blocks and suggests that a swift price movement away from these levels, breaking the current market structure, could indicate an area that the market has not correctly valued. This technique offers traders a unique method to identify potential market inefficiencies and imbalances, serving as a guide for potential price revisits.
The indicator doesn't scan for imbalances in the traditional sense — where there's an absence of trades between two price levels — but instead, it identifies quick movements away from key levels that suggest where an imbalance might exist. Relying on crossovers and cross-unders in conjunction with pivot points and examining the high/low within the same period provides an innovative method for traders to spot these potentially undervalued or overvalued areas in the market. These inferred imbalances can be crucial for traders looking for price levels where the market might make significant moves.
█ How It Works
Bullish
Crossover: The closing price of a bar crosses above a pivot high, which is an indication that buyers are in control and pushing the price upwards.
New Low Within Period: There is a lower low within the same period as the pivot high. This suggests that after setting a high, the market pulled back to set a new low, potentially leaving a price gap on the way up as the price quickly recovers.
Bearish
Crossunder: The closing price of a bar crosses under a pivot low, indicating that sellers are taking control and driving the price down.
New High Within Period: There is a higher high within the same period as the pivot low. This condition suggests that the market rallied to a new high before falling back below the pivot low, potentially leaving a gap on the way down.
█ How to Use
The enhanced order blocks are often revisited, and the price may aim to 'fill' the potential imbalance created by the rapid price movement, thereby presenting traders with potential entry or exit points. This approach aligns with the idea that imbalances are frequently revisited by the market, and when combined with the context of Order Blocks, it provides even more confluence.
Example
Here, if the price drops rapidly after setting a new high—crossing under the pivot low—it may skip over certain price levels, creating a 'gap' that signifies an area where the price might have been overvalued (imbalance), which the market may revisit for a potential price correction or revaluation.
█ Settings
Period: Determines the number of bars used for identifying pivot highs and lows. A higher value gives more significant but less frequent signals, while a lower value increases sensitivity but might give more false positives.
Pivot Surrounding: Specifies the number of candles to analyze around a pivot point. Increasing this value broadens the analysis range, potentially capturing more setups but possibly including less significant ones.
-----------------
Disclaimer
The information contained in my Scripts/Indicators/Ideas/Algos/Systems does not constitute financial advice or a solicitation to buy or sell any securities of any type. I will not accept liability for any loss or damage, including without limitation any loss of profit, which may arise directly or indirectly from the use of or reliance on such information.
All investments involve risk, and the past performance of a security, industry, sector, market, financial product, trading strategy, backtest, or individual's trading does not guarantee future results or returns. Investors are fully responsible for any investment decisions they make. Such decisions should be based solely on an evaluation of their financial circumstances, investment objectives, risk tolerance, and liquidity needs.
My Scripts/Indicators/Ideas/Algos/Systems are only for educational purposes!
Wyszukaj w skryptach "order block"

PRITESH@23Pritesh@23 (Protected)
Overview:
A flexible SMC-style indicator combining EMA trend, ADX/DMI confirmation, RSI filtering, SMC swing pivots (order-block detection), pre-entry markers, a 0–7 signalScore, and optional horizontal lines anchored to weak candles from a selected timeframe.
Key inputs:
• EMA Fast / EMA Slow
• ADX length & smoothing
• RSI length
• Swing lookback (order block detection)
• Show/hide SMC zones (order-block boxes & lines)
• Show signalScore (0–7)
• Horizontal lines TF & style controls (color, width, pattern)
• Max lines per type (to limit drawing objects)
Usage:
1. Add to chart and select preferred timeframe.
2. Adjust EMA/ADX/RSI to match instrument volatility (e.g., lower EMA for lower timeframes).
3. Use signalScore (0–7) to prioritize setups; pre-entry markers flag potential entries inside order-blocks.
4. Horizontal weak-candle lines help mark structural weakness/resilience across TFs.
Support & License:
• Protected source — code not visible to users.
• For questions/support: contact the author (provide non-sensitive contact).
• License: For personal use only. Redistribution or resale is prohibited without the author's express permission.
Version: 1.0

AD4President SMC Strong OB AlertsAD4President SMC Strong OB Alerts – Full Description
Overview:
The AD4President SMC Strong OB Alerts indicator is a multi-timeframe Smart Money Concepts (SMC) tool designed to help traders identify key Order Blocks (OBs) and potential high-probability areas of support and resistance. Inspired by premium SMC indicators, it focuses on strong OBs while filtering out weaker levels to reduce noise.
Features:
Strong vs. Weak Order Blocks
Strong OBs: Bright green (bullish) or bright red (bearish).
Weak OBs: Dimmed green (bullish) or dimmed red (bearish).
Only strong OBs trigger alerts, keeping signals clean and high-probability.
Multi-Timeframe Detection
Works across current timeframe and higher timeframes:
HTF1: 4H (configurable)
HTF2: Daily
HTF3: Weekly
Each timeframe’s OBs are visually distinct with unique colors.
50% Midpoint / Equilibrium Line
Draws a dashed line at the 50% mark of each order block.
Provides a visual reference for the OB’s equilibrium and potential price reaction points.
Alerts can trigger when price touches this midpoint for strong OBs.
Dynamic Color Coding
Strong bullish OB: Bright green
Weak bullish OB: Dim green
Strong bearish OB: Bright red
Weak bearish OB: Dim red
HTF OBs have unique color sets to distinguish them easily.
Alerts for High-Probability Levels
Alerts trigger only for strong OBs when:
Price enters the OB
Price touches the 50% midpoint of the OB
Alerts available for current timeframe and all higher timeframes.
Efficient Drawing & Cleanup
Supports up to 500 OB boxes, 500 lines, and 500 labels.
Automatically deletes old objects to prevent chart clutter.
Legend / Visual Guide
Shows which colors represent strong/weak OBs for each timeframe.
Provides quick reference to understand signals without confusion.
How Traders Use It:
Identify strong support/resistance levels via bullish and bearish OBs.
Spot potential supply and demand zones for entries or exits.
Combine with price action, break of structure, and liquidity hunts for advanced SMC trading strategies.
Alerts help you stay updated without watching charts continuously.
Settings & Customization:
lookback: Number of bars to analyze for OB formation.
show50: Enable/disable midpoint dashed line.
strongOBPct: Threshold for strong OB detection.
HTFs: Configure 3 higher timeframes to monitor multi-timeframe OBs.
showLegend: Toggle the visual legend.
Ideal For:
Swing traders, intraday traders, and position traders using Smart Money Concepts.
Traders looking to filter high-probability zones while avoiding noise from weaker OBs.

Smarter Money Concepts Dashboard [PhenLabs]📊Smarter Money Concepts Dashboard
Version: PineScript™v6
📌Description
The Smarter Money Concepts Dashboard is a comprehensive institutional trading analysis tool that combines six of our most powerful smarter money concepts indicators into one unified suite. This advanced system automatically detects and visualizes Fair Value Gaps, Inverted FVGs, Order Blocks, Wyckoff Springs/Upthrusts, Wick Rejection patterns, and ICT Market Structure analysis.
Built for serious traders who need institutional-grade market analysis, this dashboard eliminates subjective interpretation by automatically identifying where smart money is likely positioned. The integrated real-time dashboard provides instant status updates on all active patterns, making it easy to monitor market conditions at a glance.
🚀Points of Innovation
● Multi-Module Integration: Six different SMC concepts unified in one comprehensive system
● Real-Time Dashboard Display: Live tracking of all active patterns with customizable positioning
● Advanced Volume Filtering: Institutional volume confirmation across all pattern types
● Automated Pattern Management: Smart memory system prevents chart clutter while maintaining relevant zones
● Probability-Based Wyckoff Detection: Mathematical probability calculations for spring/upthrust patterns
● Dual FVG System: Both standard and inverted Fair Value Gap detection with equilibrium analysis
🔧Core Components
● Fair Value Gap Engine: Detects standard FVGs with volume confirmation and equilibrium line analysis
● Inverted FVG Module: Advanced IFVG detection using RVI momentum filtering for inversion confirmation
● Order Block System: Institutional order block identification with customizable mitigation methods
● Wyckoff Pattern Recognition: Automated spring and upthrust detection with probability scoring
● Wick Rejection Analysis: High-probability reversal patterns based on wick-to-body ratios
● ICT Market Structure: Simplified institutional concepts with commitment tracking
🔥Key Features
● Comprehensive Pattern Detection: All major SMC concepts in one indicator with automatic identification
● Volume-Confirmed Signals: Multiple volume filters ensure only institutional-grade patterns are highlighted
● Interactive Dashboard: Real-time status display with active pattern counts and module status
● Smart Memory Management: Automatic cleanup of old patterns while preserving relevant market zones
● Full Alert System: Complete notification coverage for all pattern types and signal generations
● Customizable Display Options: Adjustable colors, transparency, and positioning for all visual elements
🎨Visualization
● Color-Coded Zones: Distinct color schemes for bullish/bearish patterns across all modules
● Dynamic Box Extensions: Automatically extending zones until mitigation or invalidation
● Equilibrium Lines: Fair Value Gap midpoint analysis with dotted line visualization
● Signal Markers: Clear spring/upthrust signals with directional arrows and probability indicators
● Dashboard Table: Professional-grade status panel with module activation and pattern counts
● Candle Coloring: Wick rejection highlighting with transparency-based visual emphasis
📖Usage Guidelines
Fair Value Gap Settings
● Days to Analyze: Default 15, Range 1-100 - Controls historical FVG detection period
● Volume Filter: Enables institutional volume confirmation for gap validity
● Min Volume Ratio: Default 1.5 - Minimum volume spike required for gap recognition
● Show Equilibrium Lines: Displays FVG midpoint analysis for precise entry targeting
Order Block Configuration
● Scan Range: Default 25 bars - Lookback period for structure break identification
● Volume Filter: Institutional volume confirmation for order block validation
● Mitigation Method: Wick or Close-based invalidation for different trading styles
● Min Volume Ratio: Default 1.5 - Volume threshold for significant order block formation
Wyckoff Analysis Parameters
● S/R Lookback: Default 20 - Support/resistance calculation period for spring/upthrust detection
● Volume Spike Multiplier: Default 1.5 - Required volume increase for pattern confirmation
● Probability Threshold: Default 0.7 - Minimum probability score for signal generation
● ATR Recovery Period: Default 5 - Price recovery calculation for pattern strength assessment
Market Structure Settings
● Auto-Detect Zones: Automatic identification of high-volume thin zones
● Proximity Threshold: Default 0.20% - Price proximity requirements for zone interaction
● Test Window: Default 20 bars - Time period for zone commitment calculation
Display Customization
● Dashboard Position: Four corner options for optimal chart layout
● Text Size: Scalable from Tiny to Large for different screen configurations
● Pattern Colors: Full customization of all bullish and bearish zone colors
✅Best Use Cases
● Swing Trading: Identify major institutional zones for multi-day position entries
● Day Trading: Precise intraday entries at Fair Value Gaps and Order Block boundaries
● Trend Analysis: Market structure confirmation for directional bias establishment
● Risk Management: Clear invalidation levels provided by all pattern boundaries
● Multi-Timeframe Analysis: Works across all timeframes from 1-minute to monthly charts
⚠️Limitations
● Market Condition Dependency: Performance varies between trending and ranging market environments
● Volume Data Requirements: Requires accurate volume data for optimal pattern confirmation
● Lagging Nature: Some patterns confirmed after initial price movement has begun
● Pattern Density: High-volatility markets may generate excessive pattern signals
● Educational Tool: Requires understanding of smart money concepts for effective application
💡What Makes This Unique
● Complete SMC Integration: First indicator to combine all major smart money concepts comprehensively
● Real-Time Dashboard: Instant visual feedback on all active institutional patterns
● Advanced Volume Analysis: Multi-layered volume confirmation across all detection modules
● Probability-Based Signals: Mathematical approach to Wyckoff pattern recognition accuracy
● Professional Memory Management: Sophisticated pattern cleanup without losing market relevance
🔬How It Works
1. Pattern Detection Phase:
● Multi-timeframe scanning for institutional footprints across all enabled modules
● Volume analysis integration confirms patterns meet institutional trading criteria
● Real-time pattern validation ensures only high-probability setups are displayed
2. Signal Generation Process:
● Automated zone creation with precise boundary definitions for each pattern type
● Dynamic extension system maintains relevance until mitigation or invalidation occurs
● Alert system activation provides immediate notification of new pattern formations
3. Dashboard Update Cycle:
● Live status monitoring tracks all active patterns and module states continuously
● Pattern count updates provide instant feedback on current market condition density
● Commitment tracking for market structure analysis shows institutional engagement levels
💡Note:
This indicator represents institutional trading concepts and should be used as part of a comprehensive trading strategy. Pattern recognition accuracy improves with understanding of smart money principles. Combine with proper risk management and multiple confirmation methods for optimal results.

RUBY SYSTEM📋 Step 1: Setup & Installation
Add to TradingView:
Copy the entire Pine Script code from the artifact above
Open TradingView → Go to Pine Editor (bottom of screen)
Paste the code and click "Add to Chart"
Boom! Your chart now has institutional-level analysis
Customize Your Settings:
Click the ⚙️ gear icon on the indicator to adjust:
EMA Length: Keep at 9 (optimal for price action)
Stop Loss Method: Choose "Structure" (uses swing highs/lows)
Risk:Reward: TP1 at 1.5R, TP2 at 3R (customize as needed)
Volume Filter: Keep ON (avoids low-conviction moves)
🎯 Step 2: Reading the Visual Signals
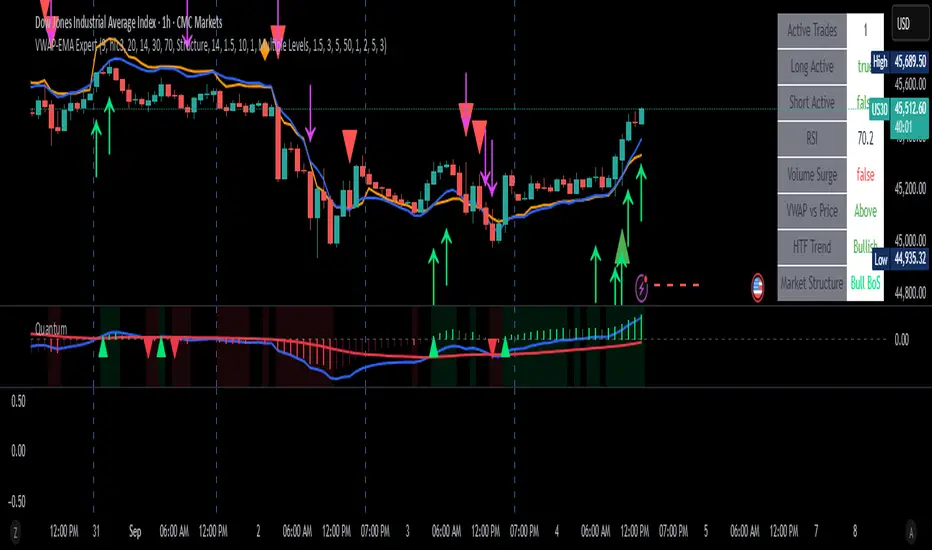
What You'll See on Your Chart:
📊 Core Lines:
🟠 Orange Line: VWAP (institutional fair value)
🔵 Blue Line: EMA 9 (trend filter)
📦 Order Flow Boxes:
🟢 Green Boxes: Bullish Order Blocks (banks bought here)
🔴 Red Boxes: Bearish Order Blocks (institutions sold here)
📱 Green/Red FVG Boxes: Fair Value Gaps (price imbalances)
🎯 Entry Signals:
🟢 Green Triangle UP: Long entry signal
🔴 Red Triangle DOWN: Short entry signal
💎 Orange Diamonds: Liquidity sweeps (stop hunts)
⬆️ Lime Arrows: Bullish Break of Structure
⬇️ Purple Arrows: Bearish Break of Structure
📏 Trade Management Lines:
🔴 Red Dashed Line: Stop Loss level
🟢 Green Dashed Line: Take Profit level
🚀 Step 3: How to Trade
🔍 BEFORE Entering Any Trade:
Check the Dashboard (top-right corner):
HTF Trend: Only trade WITH the trend
Volume Surge: Want this to be TRUE
Market Structure: Look for BoS signals
📈 LONG ENTRY Checklist:
✅ Green triangle appears (entry signal)
✅ Price above VWAP (orange line)
✅ Price above EMA (blue line)
✅ HTF Trend shows "Bullish"
✅ Volume Surge = True
✅ Recent Break of Structure UP (↑)
📉 SHORT ENTRY Checklist:
✅ Red triangle appears (entry signal)
✅ Price below VWAP (orange line)
✅ Price below EMA (blue line)
✅ HTF Trend shows "Bearish"
✅ Volume Surge = True
✅ Recent Break of Structure DOWN (↓)
💰 Step 4: Trade Management
🛑 Stop Loss (Red Dashed Line):
Automatically calculated at recent swing high/low
NEVER move your stop against you
Only move to break-even after hitting first target
🎯 Take Profit (Green Dashed Line):
TP1: 1.5 Risk:Reward (take 50% profits)
TP2: 3.0 Risk:Reward (take remaining 50%)
Or hold until price closes opposite side of EMA
🚪 Exit Rules:
LONG: Exit when price closes BELOW EMA (blue line)
SHORT: Exit when price closes ABOVE EMA (blue line)
Or hit your stop loss
🏆 Step 5: Advanced Strategies
🎪 The "Liquidity Sweep" Setup:
Wait for orange diamond (liquidity sweep)
Look for immediate reversal back into structure
Enter when green/red triangle confirms
These are PREMIUM setups - highest win rate
📦 The "Order Block Retest":
Wait for price to hit a green/red box (order block)
Look for rejection from that zone
Enter when triangle signal appears
Institutions often defend these levels
🔄 The "VWAP Retest":
Price breaks VWAP with volume
Comes back to retest VWAP (orange line)
Gets support/resistance at VWAP
Enter on triangle signal confirmation
🚨 Step 6: Risk Management Rules
⚠️ NEVER Trade When:
Volume Surge = False (low conviction)
HTF Trend contradicts your direction
No Break of Structure signal
Market Structure shows "Ranging"
💡 Position Sizing:
Risk 1-2% per trade maximum
Use the stop loss line to calculate position size
Never risk more than you can afford to lose
📊 Best Timeframes:
5M-15M: Scalping (quick in/out)
1H-4H: Swing trading (hold longer)
Daily: Position trading
🎯 Quick Start Checklist:
✅ Add indicator to chart
✅ Wait for green/red triangle signal
✅ Check dashboard shows favorable conditions
✅ Confirm HTF trend alignment
✅ Enter trade at signal
✅ Set stop at red dashed line
✅ Take profits at green dashed line
✅ Exit if price closes opposite side of EMA
🚀 Pro Tips:
Be patient - wait for ALL confirmations
Quality over quantity - fewer high-probability trades win
Practice on paper before going live
Backtest on historical data to build confidence
Set up alerts so you don't miss signals
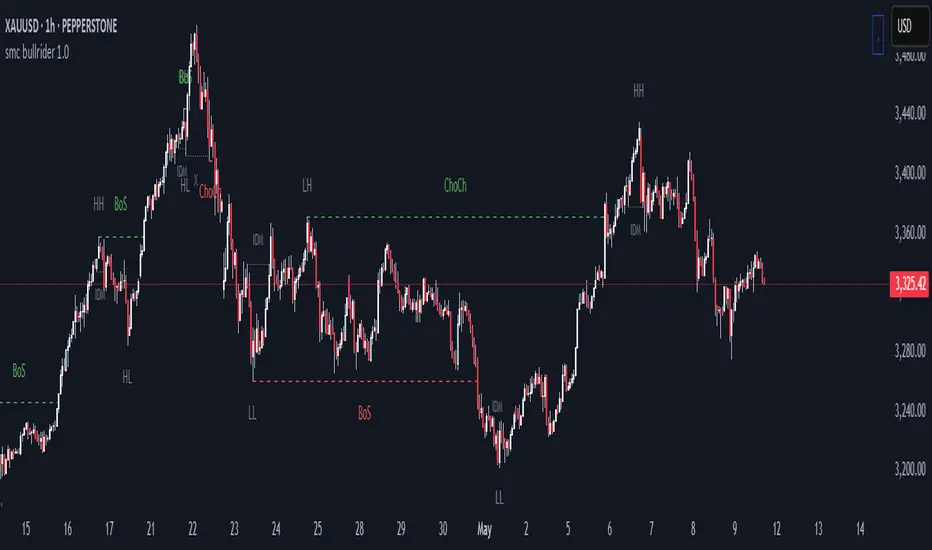
Svl - Trading SystemPrice can tell lies but volume cannot, so keeping this in mind I have created this indicator in which you see sell order block and buy order block on the basis of price action + volume through which we execute our trade
First of all, let us know its core concepts and logic, which will help you in taking the right decisions in it.
core concept of the " Svl - Trading System " TradingView indicator is based on professional price action, volume, and swing structure. This indicator smartly gives real-time insights of important price turning points, reversal zones, and trend continuation. Its deep explanation is given below.
Edit - default swing length -5 , change according your nature , tested With 7 For 5 minute timeframe
Core Concept:
1. Swing Structure Detection
The indicator automatically detects swing highs (HH/LH) and swing lows (HL/LL) on the chart.
HH: Higher High
HL: Higher Low
LH: Lower High
LL: Lower Low
These swings are the backbone of price action – signaling a change in trend, a bounce, reversal or trend continuation.
2. Order Block (OB) Mapping
Buy Order Block (Buy OB): When the indicator detects the HL/LL swing, we declare Buy OB, the lowest point of the swing.
Sell Order Block (Sell OB): On HH/LH swing, the highest point of our swing is called Sell OB.
Order Blocks are those important zones of price where historically price has reacted strongly – where major clusters of buyers/sellers are located in the market.
3. Volume Analysis (Optional Dashboard/Barcolor)
The candle color depends on the volume ranking on the chart (most high/low, normal, pressure blue shade).
Highest/lowest volume candles are a special highlight, which helps to spot liquidity spikes, exhaustion, or big orders.
4. Live Dashboard
There is an automated dashboard in the top-right of the chart, which shows this in real-time:
Last swing type (HH/HL/LH/LL)
Reversal price (last swing level)
Swing direction (Bull/Bear/Neutral)
Volume, Buy OB, Sell OB, etc.
This helps the trader understand the market situation at a glance.
5. Smart Plotting/Labels
Buy/Sell are plotted as distinct lines on the OB chart.
The Labels option gives clear visual swing points.
All calculations are fast and automated – the user does not need to mark manually.
This indicator is an advanced, fully-automated price action tool that combines
trend, reversal, volume, liquidity and zone detection in one smart system,
makes entry/exit decisions objective and error-free,
and provides complete trading confidence with a live monitor/dashboard.
All of its functions/properties such as: swing detect, OB plot, volume color, dashboard follow best practice for professional chart analysis!

Scalper - Pattern Recognition & Price Action Scalper - Pattern Recognition & Price Action Educational Indicator
**Originality and Educational Innovation**
**Why This Comprehensive Integration Merits a New Publication**
This indicator addresses a specific educational gap in technical analysis learning: **the lack of integrated pattern recognition systems that systematically combine traditional candlestick analysis with modern price action concepts in a unified confluence framework**. While individual components like moving averages, RSI, CCI, and basic candlestick patterns are well-established tools, this indicator's originality lies in its **comprehensive educational methodology** and **systematic multi-signal confluence engine**.
**Original Educational Framework:**
1. **Multi-Layer Confluence System**: Original algorithm that systematically combines 6+ different signal categories with customizable threshold requirements for educational analysis
2. **Modern Price Action Integration**: Educational implementation of Fair Value Gaps (FVG) and Order Block detection integrated with traditional pattern recognition
3. **Dynamic Support/Resistance Education**: Original strength-validated S/R system using statistical touch-count methodology rather than simple pivot points
4. **Comprehensive Pattern Library**: Educational collection combining basic and advanced candlestick patterns with mathematical validation criteria
5. **Customizable Multi-Timeframe Framework**: Educational tool allowing cross-timeframe analysis for understanding trend context
**How the Educational Components Work Together Systematically**
**Educational Layer 1 - Trend Context Understanding**: Multi-timeframe moving averages (customizable SMA/EMA/WMA/VWMA/HMA) establish directional bias for learning trend analysis
**Educational Layer 2 - Pattern Recognition Learning**: 15+ mathematically-defined candlestick patterns from basic engulfing to complex three-soldier formations demonstrate systematic pattern identification
**Educational Layer 3 - Modern Price Action Education**: Fair Value Gaps and Order Blocks teach institutional footprint recognition and market structure analysis
**Educational Layer 4 - Dynamic S/R Framework**: Strength-validated support/resistance levels demonstrate statistical validation methodology
**Educational Layer 5 - Momentum Analysis Education**: RSI and CCI extreme reversal detection teaches momentum exhaustion identification
**Educational Layer 6 - Confluence Analysis Methodology**: Original multi-signal combination system demonstrates how to systematically analyze multiple factors
This integrated educational approach provides a comprehensive framework for learning how different technical analysis concepts work together in real market conditions, addressing the common problem of studying indicators in isolation.
**Detailed Technical Implementation and Educational Methodology**
**Original Multi-Signal Confluence Algorithm**
**Educational Confluence Scoring System:**
The indicator implements an original systematic approach to signal combination:
```
Bullish Signal Categories (Educational Analysis):
- Candlestick Patterns: Strong Engulfing, Morning Star, Hammer, Three White Soldiers
- Momentum Indicators: RSI oversold exit (75→70), CCI extreme reversal (-200→-180)
- Price Action: Volume-confirmed breakouts above resistance levels
Bearish Signal Categories (Educational Analysis):
- Candlestick Patterns: Bearish Engulfing, Evening Star, Hanging Man, Three Black Crows
- Momentum Indicators: RSI overbought exit (25→30), CCI extreme reversal (200→180)
- Price Action: Volume-confirmed breakdowns below support levels
Original Confluence Calculation:
User-configurable minimum threshold (2-6 signals required)
Real-time signal counting with dynamic visual feedback
Educational labels showing current signal strength
```
**Why This Systematic Approach is Original:**
Most indicators show patterns individually without systematic combination methodology. This indicator provides an educational framework for understanding how to weight and combine different types of analysis systematically.
**Advanced Pattern Recognition with Educational Validation**
**Original Pattern Validation Methodology:**
Each pattern includes multiple educational validation criteria:
```
Strong Engulfing Educational Criteria:
- Body size > ATR (volatility filter for market significance)
- Current body > previous body (strength confirmation)
- Complete price engulfment (mathematical validation)
- Volume confirmation (market participation validation)
Morning/Evening Star Educational Framework:
- First candle: Directional (bull/bear confirmation)
- Second candle: Indecision (body < 30% of current body)
- Third candle: Reversal confirmation with penetration validation
Three Soldiers/Crows Educational Requirements:
- Three consecutive candles meeting directional criteria
- Each candle body > ATR * 0.5 (significance filter)
- Progressive price advancement (momentum validation)
```
**Modern Price Action Educational Implementation**
**Original Fair Value Gap Detection Algorithm:**
```
Educational FVG Identification:
Bullish FVG: current_low > high AND close > open AND close < open
Bearish FVG: current_high < low AND close < open AND close > open
Educational Purpose: Understanding institutional inefficiencies
Visual Education: Semi-transparent boxes showing gap zones
Practical Learning: Identifying potential reversal or continuation areas
```
**Original Order Block Educational Detection:**
```
Educational Order Block Criteria:
Bullish: Previous candle bullish AND current close > previous high AND volume > 20-period average
Bearish: Previous candle bearish AND current close < previous low AND volume > 20-period average
Educational Purpose: Recognizing institutional accumulation/distribution
Visual Education: Highlighted zones showing institutional interest
Learning Application: Understanding market structure concepts
```
**Dynamic Support/Resistance Educational System**
**Original Strength-Validation Algorithm:**
```
Educational S/R Methodology:
1. Identify recent swing highs/lows over user-defined period
2. Calculate ATR-based tolerance levels (volatility adjustment)
3. Count historical touches within tolerance (statistical validation)
4. Create levels only when touches ≥ minimum strength requirement
5. Project levels forward for future price interaction analysis
Educational Advantage over Simple Pivots:
- Statistical validation through touch counting
- Volatility-adjusted tolerance (adapts to market conditions)
- Strength-based filtering (reduces noise)
- Forward-looking projection (practical application)
```
**Comprehensive Educational Features and Customization**
**Multi-Timeframe Educational Framework**
- **MA 1**: SMA 34 with customizable timeframe (short-term trend education)
- **MA 2**: SMA 63 with customizable timeframe (medium-term trend education)
- **MA 3**: User-selectable type (SMA/EMA/WMA/VWMA/HMA) with customizable timeframe
- **MA 4**: User-selectable type for long-term trend context
- **Educational Purpose**: Understanding cross-timeframe trend analysis
**Educational Pattern Detection Parameters**
- **ATR Length**: Volatility measurement for pattern significance (default: 14)
- **Volume Validation**: Historical volume comparison for pattern confirmation
- **Mathematical Ratios**: Precise wick/body ratios for pattern classification
- **Strength Filters**: Size and volume thresholds ensuring pattern validity
**Educational Price Action Configuration**
- **FVG Detection**: Three-candle gap analysis with directional confirmation
- **Order Block Settings**: Volume threshold and visual projection length
- **S/R Parameters**: Detection period, minimum touch count, tolerance calculation
- **Educational Visualization**: Clear boxes and labels for learning identification
**Customizable Educational Dashboard**
- **Position Control**: 6 different dashboard positions for optimal viewing
- **Color Customization**: Full color control for text, backgrounds, and signals
- **Real-Time Education**: Current RSI, CCI, ATR values for learning
- **Signal Analysis**: Live bullish/bearish signal counts for confluence education
- **Educational Branding**: Clear identification as learning tool
Educational Applications and Learning Outcomes
**Progressive Learning Structure for Technical Analysis**
**Beginner Level Education:**
- Moving average trend identification across timeframes
- Basic candlestick pattern recognition with mathematical criteria
- Introduction to support/resistance concepts with visual validation
**Intermediate Level Education:**
- Multi-pattern analysis and pattern strength assessment
- RSI and CCI momentum analysis with extreme level identification
- Volume analysis integration with pattern confirmation
**Advanced Level Education:**
- Fair Value Gap theory and practical institutional analysis
- Order Block detection and market structure understanding
- Multi-signal confluence methodology and systematic signal combination
**Practical Educational Workflow**
1. **Setup Phase**: Configure moving averages for chosen timeframes and enable desired patterns
2. **Context Analysis**: Study trend direction using multi-timeframe MA alignment
3. **Pattern Study**: Identify candlestick formations meeting mathematical validation criteria
4. **Price Action Learning**: Analyze FVG and Order Block formations for institutional insight
5. **Confluence Education**: Count and analyze multiple signal types for probability assessment
6. **Real-Time Practice**: Use dashboard for ongoing market analysis and signal tracking
**Educational Risk Management Concepts**
- **Pattern Reliability Understanding**: Learning which patterns have higher success rates
- **Signal Strength Analysis**: Understanding how confluence affects probability
- **Market Context Education**: Learning when patterns are most/least reliable
- **Systematic Analysis**: Developing consistent methodology for market evaluation
**Technical Requirements and Optimization**
**Performance Optimization for Education**
- **Visual Element Limits**: 500 maximum boxes, lines, and labels for stable performance
- **Efficient Calculations**: S/R updates every 10 bars for smooth operation
- **Memory Management**: Proper array management for dynamic level storage
- **Clean Interface**: Organized input groups for easy educational navigation
**Educational Visualization Standards**
- **Color-Coded Learning**: Consistent color scheme for pattern identification
- **Clear Labeling**: Educational text labels for all major patterns and signals
- **Professional Layout**: Organized visual hierarchy for systematic learning
- **Customizable Display**: User control over visual elements and positioning
**Educational Disclaimers and Learning Focus**
**Educational Purpose Statement**
This indicator is designed as a comprehensive educational tool for learning technical analysis concepts. It demonstrates how traditional candlestick analysis, modern price action concepts, and systematic confluence methodology can be integrated for educational purposes.
**Learning Tool Disclaimer**
The indicator provides an educational framework for studying:
- Traditional and modern technical analysis integration
- Systematic pattern recognition methodology
- Multi-signal confluence analysis techniques
- Price action and market structure principles
- Statistical validation approaches for support/resistance
**Risk Education and Understanding**
Technical analysis education requires understanding that:
- Patterns and indicators show historical relationships, not future guarantees
- Confluence analysis increases probability understanding but not certainty
- Educational study should focus on methodology rather than signal generation
- Proper risk management principles must be learned alongside technical analysis
- Real market conditions may differ from educational examples
**Systematic Learning Approach**
This educational tool emphasizes:
- **Methodology over Signals**: Focus on learning systematic analysis approaches
- **Understanding over Automation**: Developing analytical skills rather than relying on automated signals
- **Education over Trading**: Comprehensive learning framework for technical analysis concepts
- **Progressive Development**: Building skills systematically from basic to advanced concepts
**Technical Documentation and Implementation**
**Original Algorithm Documentation**
All custom algorithms are documented for educational transparency:
- Pattern detection mathematics with specific criteria
- Confluence scoring methodology with threshold requirements
- Support/resistance validation with statistical touch counting
- Price action detection with institutional footprint identification
**Educational Code Structure**
- **Comprehensive Comments**: Every section includes educational purpose explanation
- **Version Tracking**: Clear version documentation for educational development
- **Performance Notes**: Optimization techniques explained for learning
- **Customization Guidance**: Clear parameter explanation for educational experimentation
---
**Educational Innovation Summary:**
This implementation represents an original approach to technical analysis education, systematically combining traditional pattern recognition with modern price action concepts in an integrated confluence framework. The educational methodology addresses common learning gaps by providing systematic approaches to multi-signal analysis, statistical validation, and institutional footprint recognition.
**Learning Value:**
The comprehensive educational framework eliminates the need to study multiple separate indicators by providing an integrated learning platform that demonstrates how different technical analysis concepts work together systematically in real market conditions.
**Educational Commitment:**
This indicator prioritizes education and systematic learning over simple signal generation, providing traders with the analytical framework needed to develop comprehensive technical analysis skills through hands-on practice and systematic methodology development.

SMC Pro - Smart Money Concepts🎯 SMC Pro - Complete Smart Money Concepts Trading System with Trade Alerts
The Most Comprehensive SMC/ICT Indicator Built for Real Traders
After extensive research into what retail and prop firm traders actually need, I've created SMC Pro - a complete Smart Money Concepts indicator that solves the biggest problems with existing SMC tools.
🚀 What Makes This Different:
✅ COMPLETE TRADE SETUP ALERTS - Not just structure breaks! Get full trade setups with:
* Entry, Stop Loss & Target Prices
* Risk/Reward Calculations
* 5-Point Confluence Scoring
* Visual Trade Labels on Chart
✅ INTELLIGENT FILTERING - No more chart spam:
* Minimum structure size filter (ATR-based)
* Minimum bars between signals
* Volume confirmation for order blocks
* Clean, actionable signals only
📊 Core Features:
1. Market Structure Analysis
* Break of Structure (BOS) with smart filtering
* Change of Character (CHoCH) detection
* Clear directional bias identification
* Prevents excessive signal clustering
2. Order Blocks
* Volume-confirmed institutional zones
* Automatic mitigation tracking
* Entry points for trade setups
3. Fair Value Gaps
* ATR-based size filtering
* Automatic fill detection
* Confluence factor for trades
4. Liquidity Zones
* Buy-side & Sell-side liquidity mapping
* Sweep detection with alerts
* Target zones for trades
5. Risk Management Integration
* Automatic R:R calculation
* Position sizing guidance
* Minimum R:R filtering (default 2:1)
🎯 5-Point Trade Confluence System:
1. Market structure alignment
2. Recent structure break (BOS/CHoCH)
3. Order block at current price
4. Fair value gap support
5. Liquidity target available
Minimum score of 3/5 required for trade alerts (adjustable)
⚙️ Smart Settings:
* Swing Length: 10 (default) - adjust for sensitivity
* Min Bars Between Signals: 20 - prevents clustering
* Min Structure Size: 1.0 ATR - filters noise
* Min Confluence Score: 3/5 - quality control
* Target R:R: 2:1 minimum - proper risk management
📱 Alert Types:
* 🎯 Trade Setup Alerts - Complete entry/exit plans
* ✅ Structure Breaks - BOS & CHoCH notifications
* 📊 Order Block Touch - Price at key zones
* 💧 Liquidity Sweeps - Stop hunts detected
💡 Pro Tips:
* Start with default settings
* Use on 15m+ timeframes for cleaner signals
* Increase confluence requirement for prop firm trading
* Enable volume confirmation for higher quality OBs
* Dashboard shows real-time setup status
🔧 If You Get Too Many Signals:
* Increase Swing Length to 15-20
* Increase Min Bars Between to 30-50
* Increase Min Structure Size to 1.5 ATR
* Raise Min Confluence Score to 4 or 5
This indicator is the result of solving real problems traders face with SMC/ICT concepts. It's designed to give you clean, actionable trade setups - not just mark up your chart with zones.
Built with Pine Script v6 for maximum performance and reliability.
Trade with confluence. Trade with confidence. Trade smart. 🎯

Smart MTF S/R Levels[BullByte]
Smart MTF S/R Levels
Introduction & Motivation
Support and Resistance (S/R) levels are the backbone of technical analysis. However, most traders face two major challenges:
Manual S/R Marking: Drawing S/R levels by hand is time-consuming, subjective, and often inconsistent.
Multi-Timeframe Blind Spots: Key S/R levels from higher or lower timeframes are often missed, leading to surprise reversals or missed opportunities.
Smart MTF S/R Levels was created to solve these problems. It is a fully automated, multi-timeframe, multi-method S/R detection and visualization tool, designed to give traders a complete, objective, and actionable view of the market’s most important price zones.
What Makes This Indicator Unique?
Multi-Timeframe Analysis: Simultaneously analyzes up to three user-selected timeframes, ensuring you never miss a critical S/R level from any timeframe.
Multi-Method Confluence: Integrates several respected S/R detection methods—Swings, Pivots, Fibonacci, Order Blocks, and Volume Profile—into a single, unified system.
Zone Clustering: Automatically merges nearby levels into “zones” to reduce clutter and highlight areas of true market consensus.
Confluence Scoring: Each zone is scored by the number of methods and timeframes in agreement, helping you instantly spot the most significant S/R areas.
Reaction Counting: Tracks how many times price has recently interacted with each zone, providing a real-world measure of its importance.
Customizable Dashboard: A real-time, on-chart table summarizes all key S/R zones, their origins, confluence, and proximity to price.
Smart Alerts: Get notified when price approaches high-confluence zones, so you never miss a critical trading opportunity.
Why Should a Trader Use This?
Objectivity: Removes subjectivity from S/R analysis by using algorithmic detection and clustering.
Efficiency: Saves hours of manual charting and reduces analysis fatigue.
Comprehensiveness: Ensures you are always aware of the most relevant S/R zones, regardless of your trading timeframe.
Actionability: The dashboard and alerts make it easy to act on the most important levels, improving trade timing and risk management.
Adaptability: Works for all asset classes (stocks, forex, crypto, futures) and all trading styles (scalping, swing, position).
The Gap This Indicator Fills
Most S/R indicators focus on a single method or timeframe, leading to incomplete analysis. Manual S/R marking is error-prone and inconsistent. This indicator fills the gap by:
Automating S/R detection across multiple timeframes and methods
Objectively scoring and ranking zones by confluence and reaction
Presenting all this information in a clear, actionable dashboard
How Does It Work? (Technical Logic)
1. Level Detection
For each selected timeframe, the script detects S/R levels using:
SW (Swing High/Low): Recent price pivots where reversals occurred.
Pivot: Classic floor trader pivots (P, S1, R1).
Fib (Fibonacci): Key retracement levels (0.236, 0.382, 0.5, 0.618, 0.786) over the last 50 bars.
Bull OB / Bear OB: Institutional price zones based on bullish/bearish engulfing patterns.
VWAP / POC: Volume Weighted Average Price and Point of Control over the last 50 bars.
2. Level Clustering
Levels within a user-defined % distance are merged into a single “zone.”
Each zone records which methods and timeframes contributed to it.
3. Confluence & Reaction Scoring
Confluence: The number of unique methods/timeframes in agreement for a zone.
Reactions: The number of times price has touched or reversed at the zone in the recent past (user-defined lookback).
4. Filtering & Sorting
Only zones within a user-defined % of the current price are shown (to focus on actionable areas).
Zones can be sorted by confluence, reaction count, or proximity to price.
5. Visualization
Zones: Shaded boxes on the chart (green for support, red for resistance, blue for mixed).
Lines: Mark the exact level of each zone.
Labels: Show level, methods by timeframe (e.g., 15m (3 SW), 30m (1 VWAP)), and (if applicable) Fibonacci ratios.
Dashboard Table: Lists all nearby zones with full details.
6. Alerts
Optional alerts trigger when price approaches a zone with confluence above a user-set threshold.
Inputs & Customization (Explained for All Users)
Show Timeframe 1/2/3: Enable/disable analysis for each timeframe (e.g., 15m, 30m, 1h).
Show Swings/Pivots/Fibonacci/Order Blocks/Volume Profile: Select which S/R methods to include.
Show levels within X% of price: Only display zones near the current price (default: 3%).
How many swing highs/lows to show: Number of recent swings to include (default: 3).
Cluster levels within X%: Merge levels close together into a single zone (default: 0.25%).
Show Top N Zones: Limit the number of zones displayed (default: 8).
Bars to check for reactions: How far back to count price reactions (default: 100).
Sort Zones By: Choose how to rank zones in the dashboard (Confluence, Reactions, Distance).
Alert if Confluence >=: Set the minimum confluence score for alerts (default: 3).
Zone Box Width/Line Length/Label Offset: Control the appearance of zones and labels.
Dashboard Size/Location: Customize the dashboard table.
How to Read the Output
Shaded Boxes: Represent S/R zones. The color indicates type (green = support, red = resistance, blue = mixed).
Lines: Mark the precise level of each zone.
Labels: Show the level, methods by timeframe (e.g., 15m (3 SW), 30m (1 VWAP)), and (if applicable) Fibonacci ratios.
Dashboard Table: Columns include:
Level: Price of the zone
Methods (by TF): Which S/R methods and how many, per timeframe (see abbreviation key below)
Type: Support, Resistance, or Mixed
Confl.: Confluence score (higher = more significant)
React.: Number of recent price reactions
Dist %: Distance from current price (in %)
Abbreviations Used
SW = Swing High/Low (recent price pivots where reversals occurred)
Fib = Fibonacci Level (key retracement levels such as 0.236, 0.382, 0.5, 0.618, 0.786)
VWAP = Volume Weighted Average Price (price level weighted by volume)
POC = Point of Control (price level with the highest traded volume)
Bull OB = Bullish Order Block (institutional support zone from bullish price action)
Bear OB = Bearish Order Block (institutional resistance zone from bearish price action)
Pivot = Pivot Point (classic floor trader pivots: P, S1, R1)
These abbreviations appear in the dashboard and chart labels for clarity.
Example: How to Read the Dashboard and Labels (from the chart above)
Suppose you are trading BTCUSDT on a 15-minute chart. The dashboard at the top right shows several S/R zones, each with a breakdown of which timeframes and methods contributed to their detection:
Resistance zone at 119257.11:
The dashboard shows:
5m (1 SW), 15m (2 SW), 1h (3 SW)
This means the level 119257.11 was identified as a resistance zone by one swing high (SW) on the 5-minute timeframe, two swing highs on the 15-minute timeframe, and three swing highs on the 1-hour timeframe. The confluence score is 6 (total number of method/timeframe hits), and there has been 1 recent price reaction at this level. This suggests 119257.11 is a strong resistance zone, confirmed by multiple swing highs across all selected timeframes.
Mixed zone at 118767.97:
The dashboard shows:
5m (2 SW), 15m (2 SW)
This means the level 118767.97 was identified by two swing points on both the 5-minute and 15-minute timeframes. The confluence score is 4, and there have been 19 recent price reactions at this level, indicating it is a highly reactive zone.
Support zone at 117411.35:
The dashboard shows:
5m (2 SW), 1h (2 SW)
This means the level 117411.35 was identified as a support zone by two swing lows on the 5-minute timeframe and two swing lows on the 1-hour timeframe. The confluence score is 4, and there have been 2 recent price reactions at this level.
Mixed zone at 118291.45:
The dashboard shows:
15m (1 SW, 1 VWAP), 5m (1 VWAP), 1h (1 VWAP)
This means the level 118291.45 was identified by a swing and VWAP on the 15-minute timeframe, and by VWAP on both the 5-minute and 1-hour timeframes. The confluence score is 4, and there have been 12 recent price reactions at this level.
Support zone at 117103.10:
The dashboard shows:
15m (1 SW), 1h (1 SW)
This means the level 117103.10 was identified by a single swing low on both the 15-minute and 1-hour timeframes. The confluence score is 2, and there have been no recent price reactions at this level.
Resistance zone at 117899.33:
The dashboard shows:
5m (1 SW)
This means the level 117899.33 was identified by a single swing high on the 5-minute timeframe. The confluence score is 1, and there have been no recent price reactions at this level.
How to use this:
Zones with higher confluence (more methods and timeframes in agreement) and more recent reactions are generally more significant. For example, the resistance at 119257.11 is much stronger than the resistance at 117899.33, and the mixed zone at 118767.97 has shown the most recent price reactions, making it a key area to watch for potential reversals or breakouts.
Tip:
“SW” stands for Swing High/Low, and “VWAP” stands for Volume Weighted Average Price.
The format 15m (2 SW) means two swing points were detected on the 15-minute timeframe.
Best Practices & Recommendations
Use with Other Tools: This indicator is most powerful when combined with your own price action analysis and risk management.
Adjust Settings: Experiment with timeframes, clustering, and methods to suit your trading style and the asset’s volatility.
Watch for High Confluence: Zones with higher confluence and more reactions are generally more significant.
Limitations
No Future Prediction: The indicator does not predict future price movement; it highlights areas where price is statistically more likely to react.
Not a Standalone System: Should be used as part of a broader trading plan.
Historical Data: Reaction counts are based on historical price action and may not always repeat.
Disclaimer
This indicator is a technical analysis tool and does not constitute financial advice or a recommendation to buy or sell any asset. Trading involves risk, and past performance is not indicative of future results. Always use proper risk management and consult a financial advisor if needed.

Advanced SMC Market Structure AnalyzerAdvanced SMC Market Structure Analyzer
Version 1.0 • by Rendon1
Short Description:
A multi-timeframe Smart Money Concepts (SMC) toolkit for detecting Breaks of Structure (BOS), Changes of Character (CHoCH), liquidity zones, order blocks, fair-value gaps, and raw entry signals—all in one overlay indicator.
🔍 Overview
This script analyzes both a higher timeframe (e.g. 4H) for market structure shifts and a lower “entry” timeframe (e.g. 5–30 m) to flag optimal entries. It visually marks:
BOS (Higher-Highs/Bearish BOS & Lower-Lows/Bullish BOS)
CHoCH (structure flips)
Liquidity Zones (equal highs/lows)
Order Blocks (last candle before a directional move)
Fair-Value Gaps on the entry timeframe
Buy/Sell Labels when multiple conditions align
⚙️ Features
Multi-Timeframe Structure: Define your higher-timeframe for HTF swings and a customizable lower-timeframe for precision entries.
Swing Sensitivity: Adjustable pivot lookback (default 5 bars).
Liquidity Detection: Highlights market stagnation points via equal highs/lows.
Order Blocks & FVG: Identifies key institutional zones on both HTF and LTF.
Automated Entry Signals: Composite logic combining CHoCH with LTF order blocks or fair-value gaps.
Alerts Built-In: “Bullish Entry,” “Bearish Entry,” “CHoCH Detected,” and “BOS Detected.”
⚙️ Inputs
Setting Default Description
Swing Detection Sensitivity 5 Lookback bars for pivot detection (higher = smoother)
Show Structure Labels ☑️ Toggle visual BOS/CHoCH labels
HTF Structure Timeframe 240 Higher-timeframe (minutes) for market structure
Entry Structure Timeframe 15 Lower-timeframe for order block & FVG entries
Liquidity Lookback 3 Bars to check for equal highs/lows
📖 How to Use
Add to Chart: Apply the indicator to any symbol.
Configure Timeframes: Choose your preferred HTF (e.g. 4H) and LTF (e.g. 15 m).
Interpret Signals:
Blue “BOS” labels mark momentum breaks on HTF.
Orange “CHoCH” labels indicate structure flips.
Green “🟢 BUY” and Red “🔴 SELL” labels appear when HTF flips align with LTF zones.
Set Alerts: Right-click any of the built-in alert conditions to add real-time notifications.
⚠️ Disclaimer
This script is for educational purposes only and does not constitute financial advice. Trading involves risk, and you should perform your own analysis before making any trades. The author is not liable for any losses or gains resulting from the use of this indicator.

SMC Entry Signals MTF v2📘 User Guide for the SMC Entry Signals MTF v2 Indicator
🎯 Purpose of the Indicator
This indicator is designed to identify reversal entry points based on Smart Money Concepts (SMC) and candlestick confirmation. It’s especially useful for traders who use:
Imbalance zones, order blocks, breaker blocks
Liquidity grabs
Multi-timeframe confirmation (MTF)
📈 How to Use the Signals on the Chart
✅ LONG Signal (green triangle below the candle):
Conditions:
Price is in a discount zone (below the FIB 50% level)
A bullish engulfing candle appears
A bullish Order Block (OB) or Breaker Block is detected
There’s an upward imbalance
A bullish OB is confirmed on the higher timeframe
➡️ How to act:
Consider entering long on the current or next candle.
Place your stop-loss below the OB or the nearest swing low.
Take profit at the nearest liquidity zone or premium area (above FIB 50%).
🔻 SHORT Signal (red triangle above the candle):
Conditions:
Price is in a premium zone (above FIB 50%)
A bearish engulfing candle appears
A bearish OB or Breaker Block is detected
There’s a downward imbalance
A bearish OB is confirmed on the higher timeframe
➡️ How to act:
Consider short entry after the signal.
Place your stop-loss above the OB or swing high.
Target the discount zone or the next liquidity pocket.
⚙️ Recommended Settings by Trading Style
Trading Style Suggested Settings Notes
Intraday (1–15m) fibLookback = 20–50, obLookback = 5–10, htf_tf = 1H/4H Fast signals. Use Discount/Premium + Engulfing.
Swing/Position (1H–1D) fibLookback = 50–100, obLookback = 10–20, htf_tf = 1D/1W Higher trust in MTF confirmation. Ideal with fundamentals.
Scalping (1m) fibLookback = 10–20, obLookback = 3–5, htf_tf = 15m/1H Remove Breaker and MTF for quick reaction trades.
🧠 Best Practices for Traders
Trend Filtering:
Use EMAs or volume to confirm the current trend.
Take longs only in uptrends, shorts in downtrends.
Liquidity Zones:
Use this indicator after liquidity grabs.
OBs and Breakers often appear right after stop hunts.
Combine with Manual Zones:
This works best when paired with manually drawn OBs and key levels.
Backtest the Signals:
Use Bar Replay mode on TradingView to test past signals.
🧪 Example Trade Setup
Example on BTCUSDT 15m:
Price drops into the discount zone.
A green triangle appears (bullish engulfing + OB + imbalance + HTF OB).
You enter long, stop below the OB, target the premium zone.
🎯 This type of setup often gives a risk/reward ratio of 1:2 or better — profitable even with a 40% win rate.
⏰ Alerts & Automation
Enable alerts:
"SMC Long Entry" — fires when a long signal appears.
"SMC Short Entry" — fires when a short signal appears.
You can integrate this with bots via webhook, like:
TradingConnector, 3Commas, Alertatron, etc.
✅ What This Indicator Gives You
High-probability entries using SMC logic
Customizable filters for entry logic
Multi-timeframe confirmation for stronger setups
Suitable for both intraday and swing trading

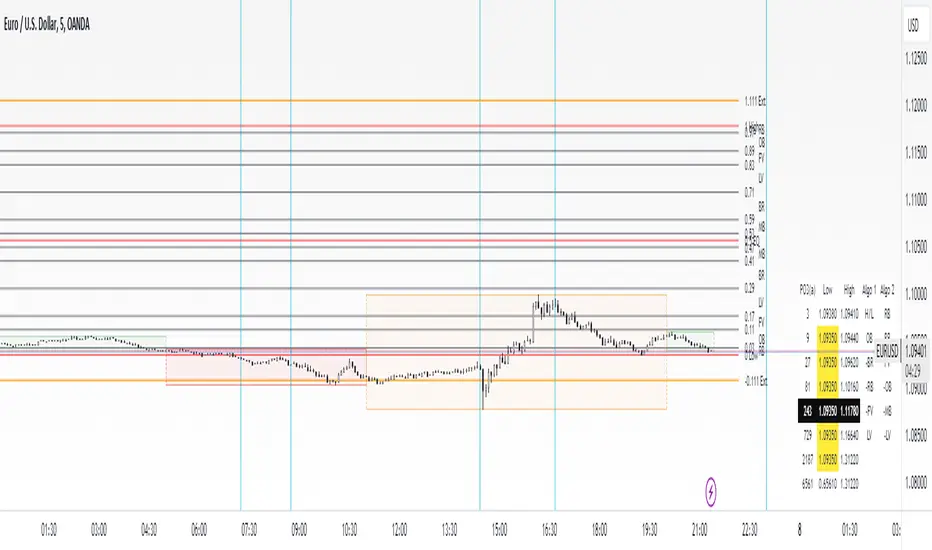
Model Indicator |ASE|The purpose of this indicator is to allow the user to build their own model. Each feature works cohesively together and depending on the filters you enable, the model gives less and more specific entries. This benefits the trader because they have complete control over the kinds of trades they want to take, while maintaining its automatic form.
We want to be as customizable as possible while still meeting our users’ needs. We started this indicator to propel us into our ultimate project, the ASE Algo.
Features:
SMC Display
Current Structure:
Liquidity Levels:
Daily Premium Discount Array
SMT Divergence
Displacement Candles:
Entry Factors
FVG
Continuation FVGs
MTF FVGs
Order Blocks
MTF Order Blocks
Confluence Filters
MS Reversal
Liquidity Level Raid
Inducement
Daily Prem/Disc Array
Target Factors
Liquidity Level Targets
Current Structure Targets
Trade Management
Trade Overlay
Risk:Reward Target
Benefits & Examples:
In the image below the indicator signaled multiple entries based on two simple confluence filters, a MS reversal (CHoCH/MSS) and a Liquidity Raid. Going from left to right we can see a short entry at the highs with a supporting Order Block. Liquidity levels are taken before we see a double IDM right below the respected OB that leads to the next signaled entry. In the middle of the chart we see a long entry that leads right into a short entry showing the effectiveness of such a simple model.
In this supporting image we are showcasing the first implementation of the Trade Overlay feature. This feature displays the Entry and Stop Loss to make it more visible and adds a risk to reward target. Additionally displayed is the SMC Toolkit indicator showing us additional confirmation with our signaled entries playing right out of a higher timeframe FVG.
An additional entry feature is the MTF zone. Setups can form on all timeframes and subjecting yourself to only one may lead you to miss out on some perfect setups or a larger move. In the image below we are on the 1 minute timeframe. We can see the Initial Reversal Entry which played out beautifully and filled a higher timeframe SFVG. With the MTF zone we can see a 3 minute and 5 minute Zone which produces the rest of the trend reaching another higher timeframe SFVG after filling the previous one. Once again showing the benefit of the Toolkit indicator but the plotted entries from such a simple model.
In addition to the model indicators filtered out entry zone, we can use additional confluences to confirm these entries. In the image below we can see a short entry printed after a move out of the Std. Dev. vwap wave which shows over extension. Taking the entry we can have a tight stop loss at the vwap wave or the recent high where we have a liquidity level, targeting a lower liquidity level or higher timeframe FVG.
For this example we are only filtering based on MS Reversals (CHoCH/MSS) to get our entries. Because of this we need additional confirmation to be confident in taking the plotted entry. In the image below you can see a long signal printed, confirmation being the previous Failed Reversal.

dmn's ICT AMD-Goldbach█ OVERVIEW
This script is built on ICT time & price theory and the theory of algorithmic market maker models, and visualizes the intraday divided using powers of three into accumulation, manipulation and distribution cycles.
It also includes an automatically calculated and plotted Goldbach level (a.k.a. IPDA level or Huddleston level) overlay, to help visualize where in the current market maker profile price is in relation to the AMD cycles, and where it might trade to.
█ CONCEPTS
Accumulation, Manipulation, Distribution Cycles
A 24 hour day, with the default set to start at 20:00 CET (the start of the Forex CLS Settlement operational timeline) is split in three parts - 9, 6 and 9 hours for the three cycles (roughly corresponding with Asia, London Open and New York + London Close sessions).
Since charts are fractals, there's also intra-cycle time fibs available in the script, to highlight the smaller fractal equivalents in each cycle.
These cycles are used to visualize the three phases (AMD) for easier identification of the current daily profile by analyzing during what cycle highs and lows of the day are made.
An example of a bullish day could be price rallying before making a low during the accumulation cycle, being manipulated higher and retracing to form an optimal trade entry during the manipulation cycle, expanding and creating the high of the day before selling off during the distribution cycle, with a potential reversal before it ends.
Goldbach levels
The Goldbach levels are based on the size of a price range (or price swing, if you will) expressed as a factor of power of three (3^n).
To decide what number to tell the script to use for the calculation, we look at what 3^n number best fits an average swing on the preferred timeframe we're trading.
For example; PO3 27 (3^3)might be fit for scalping, while PO3 243 (3^5) may correspond to the daily or weekly range, depending on the asset.
The script then calculates a range high and a range low using a power of three formula based on the current price and divides it into levels using Goldbach numbers.
At these levels one might expect to see price form various "blocks" as defined in concept by Michael J. Huddleston.
The blocks that correspond to the Goldbach levels are labeled with abbreviations as follows:
Ext = External range
Low = Range low
High = Range high
FVG = Fair value gap
RB = Rejection block
OB = Order block
LV = Liquidity void
BR = Breaker
MB = Mitigation block
Using these levels and said blocks we identify where in the current running market maker profile price is offered, and trade the preferred timeframe in line with the AMD cycles accordingly.
█ FEATURES
Custom AMD time cycles session times.
Custom time fib for fractal cycles.
Color and style customization.
Show only current or also historical cycles.
Equilibrium mode for Goldbach levels (show only high/low and midpoint)
Autodetection of asset type, with manual override.
█ NOTE
The default timings for the AMD cycles are set up for Forex pairs. For other asset types, such as indices, other timings are nessecary for optimal results.
Goldbach levels requires the correct symbol type setting for the calculation to work properly. Disable the script's autodetection and enable/disable the Forex option according to the type of chart if it fails.
Smart Money BusterAfter daytrading for a while i came into conclusion that price action trading is the most successful way to trade for me and this project was for me to simplify my way of trading at the beginning. Eventually it got big and turned into a very useful helper indicator for me to setup on different pairs for alerts and only look at the charts to decide for entry when the alerts come from 120 different pairs that i set it up. Since i always looked at indicators for a way to make my job simpler and give me more time to do more important things for me rather than drawing lines on different pairs eveyday i think it got to a point where it works to my liking and making me gain time, thus more money.
This indicator uses smart money concepts like Market Structure, Order Blocks, Quassimodo Levels, Structure Breaks, Pumps and Dumps, Imbalances(In the works will be added in first update) to help trader catch what the whales are thinking and how to enter in the right time for swing trading, catching bottoms and tops.
Here are some of the features as of release:
Detects Market Structure and draws zig-zag lines and keeps note of pivot points.
Detects Order blocks and draws boxes when the conditions met
Detects the quassimodo levels and changes the color of the box to signal double confluence meaning stronger signal
Draws structure break lines
Setting to set structure break percentage before drawing boxes to get the boxes drawn if you want to be more 'sure' about the Order Block Levels.
Setting to change depth and backstep values for zigzags to be able to let you fit the system for different time frames.
Setting to set MSB trigger point between High and Low, Close and Open or hl2 values.
Setting to set Signal Triggering Range between Start, Middle and End meaning eg. if you set it to Middle it will wait for MSB trigger point to hit the middle of the box before giving you a signal.
Setting for changing HH-LL pivot points lookback count, 5 as default. Increasing this value will make you compare your pivot points with more data, really useful in lower time frames where will be a lot of zig-zags and highs and lows giving you a method to avoid false signals. Recommended to keep it lower values on 30 min and higher and increase it in lower Timeframes according to market volatility.
Setting to add a Box limit where the box of order block will be set invalid after certain candles and it still didn't trigger. Default value of 0 means it's disabled.
Setting to set Candle volatility percentage value to avoid big candles getting opposite signals on fast pump or dump schemes and bust those market makers schemes. Gotta say this came out really handy in crypto markets :)
As an end you can set alerts for 'Buy' , ' Sell ', ' Buy and Sell' together or if you wish you can connect it to bots via webhook as an entry. Although haven't connected to any bots myself as i think the best method of trading is human and machine working together. Since we have the creativity and out of the box thinking and machines have the ability to brute force calculation and huge bandwith that we don't currently have. At least until Elon Musk turns is into a cyborg, which i am not very eager about.
Planned Features:
- Add ability to detect imbalances(fair value gaps) to add third confluence to detect dragon fruit entries. This will make the system work with triple confluence.
- Add more settings so humans can command the ai better.
- Maybe a strategy version after i write my own dynamic take profit algorithm to give system ability make quantitative decisions based on current position profit levels.
- Although i think i fixed almost all the important bugs if there ever comes up one bugs will take priority for updates.
- And some things i may decide to add later. I will keep working on this project since it works well for me.
And like always, happy trading.

SMC Structure SuiteSMC Structure Suite — BOS, CHOCH & Order Blocks
This indicator provides automated Smart Money Concepts (SMC) tools to help traders analyze market structure objectively. It is designed for traders who want to quickly identify shifts in price behavior without manually marking charts.
Core Features
Market Structure Recognition
Automatically detects Higher Highs (HH), Lower Lows (LL), Higher Lows (HL), and Lower Highs (LH). Detection uses a pullback validation mechanism to confirm swing structure.
BOS & CHOCH Detection
Identifies Break of Structure (BOS) for potential continuation and Change of Character (CHOCH) for possible reversals.
Order Block Highlighting
Marks bullish and bearish order blocks when confirmed by price action. Options allow choosing mitigation style (wick touch or body close). Blocks are hidden when invalidated.
Multi-Timeframe Analysis
Works on any timeframe. Historical analysis allows reviewing past structure.
Customizable Visuals
Colors, label positions, and background style can be adjusted for a clear chart.
Alert System
Alerts are provided for trend changes to monitor potential shifts in market direction in real time.
Disclaimer
This indicator is a tool to assist with chart analysis. It does not guarantee results and is not financial advice. Use appropriate risk management.

ICT SMC ToolKit By VIPIN | High Volume OB + BOS, CHoCH, FVG📌 ICT Smart Money Concepts (SMC) Toolkit
This indicator provides traders with a complete Smart Money Concepts (SMC) framework inside a single tool. It helps to visualize institutional trading footprints and market structure shifts more effectively without the need to combine multiple separate indicators.
---
🔹 Key Features
1. **Order Blocks (OB):**
- Automatically detects bullish and bearish order blocks.
- Helps traders identify institutional buying/selling zones where large players may be active.
- Volume filters included for more accurate signals.
2. **Break of Structure (BOS):**
- Marks market structure breaks that indicate continuation of the trend.
- Useful for identifying trend direction and confirming order flow.
3. **Change of Character (CHoCH):**
- Highlights early signs of market reversals.
- Shows when price transitions from bullish to bearish order flow (or vice versa).
4. **Fair Value Gaps (FVG):**
- Automatically draws zones of price imbalance.
- Traders can use these zones as possible retracement or entry levels.
- Helps to spot areas where price may return to "rebalance".
5. **Liquidity Sweeps:**
- Identifies liquidity grabs around recent highs and lows.
- Useful for spotting stop hunts and smart money manipulation before reversals.
6. **Custom Presets & Filters:**
- Users can toggle between OB-only, FVG-only, Sweep-only, or full SMC mode.
- Multiple color settings available for clear chart visualization.
---
🎯 Purpose of the Script
- Brings all major SMC tools (OB, BOS, CHoCH, FVG, Liquidity Sweep) together in one indicator.
- Reduces the need for multiple overlapping indicators.
- Helps traders simplify their workflow and keep charts clean.
- Focused on education, analysis, and market structure visualization.
---
⚠️ Disclaimer
This script is intended **for educational and analytical purposes only**.
It does not provide financial advice, trade recommendations, or guaranteed profits.
Traders should always manage their own risk and confirm setups with additional confluences.
---
ℹ️ Notes for Users
- This indicator works on multiple timeframes and instruments (Forex, Commodities, Indices, Crypto).
- Best used with a strong understanding of Smart Money Concepts (SMC) and ICT methodology.
- Combining this tool with your own analysis will provide the best results.

ICT Trading by JaeheeSUMMARY
• This script consolidates widely used ICT concepts into a single, coherent toolkit that emphasizes structural clarity over chart clutter.
• It renders Market Structure (BOS/CHoCH), significant Order Blocks (OB), Fair Value Gaps (FVG) with size filtering, BSL/SSL liquidity lines with optional sweep pruning, and Killzone session start markers.
• For analysis/education only. It does not provide investment advice or imply performance/returns.
WHAT MAKES IT DIFFERENT
• Integrated coverage of core ICT elements in one script (Structure, OB, FVG, BSL/SSL, Killzone).
• Quality gating so only “meaningful” zones/gaps remain (ATR/percent/tick thresholds, leg displacement, optional volume filter).
• Liquidity line maintenance: BSL/SSL can be automatically pruned after a defined sweep so attention stays on current liquidity.
• Visual minimalism: compact labels inside boxes; no background shading by default, keeping the chart readable.
• One-click contrast: a “Force Black” toggle switches all labels/lines to black for maximum legibility.
• Component-level ON/OFF controls (FVG / OB / BSL-SSL / Killzone) to tailor visibility to your workflow.
• OB de-duplication policy prevents overlapping clutter (keep-older-and-extend-right / keep-older / replace-with-new).
COMPONENTS & LOGIC (CONCISE)
• Market Structure (BOS/CHoCH)
◦ External swings via fractal pivots.
◦ BOS confirmation = close beyond the recent swing by k·ATR + a minimum real-body (first bar).
◦ Regime-aware labeling distinguishes BOS vs CHoCH.
• Order Blocks (strict ICT with significance)
◦ Demand OB: last down candle before a qualifying upside break; Supply OB: last up candle before a qualifying downside break.
◦ Filters enforce candle body, zone thickness, leg displacement (ATR-based), optional volume.
◦ Mitigation handling: Keep / Delete / Shrink (partial fills shrink the zone until invalidation).
• Fair Value Gaps (FVG)
◦ Standard 3-candle definition.
◦ Valid only when gap height ≥ max(percent threshold, ATR-based threshold, tick threshold) → trivial gaps intentionally removed.
◦ Minimal “FVG” text is centered inside the box.
• BSL / SSL & Sweep Management
◦ Equal highs/lows detected using dual tolerances (ticks + ATR) and a bar-spacing cap.
◦ Optional auto-removal after a sweep (Wick / Close / AnyTouch) so only actionable liquidity remains.
• Killzone Session Starts
◦ Compact vertical tick + label at the first bar of Asia / Europe / New York (no background fill).
INPUTS (MINIMIZED BY DESIGN)
• Visibility toggles: Show FVG / Show Order Blocks / Show BSL-SSL / Show Killzone session starts.
• Contrast toggle: Make all texts & lines BLACK (ON/OFF).
• Most numeric thresholds are internally fixed to discourage over-optimization and preserve consistent behavior.
HOW TO USE — PRACTICAL WORKFLOW
• Frame selection
◦ HTF (bias frame): choose 1H/4H/1D to read structure and map major OB/FVG.
◦ LTF (execution frame): 1–15 minute range; prefer trades aligned with the HTF bias.
• Long scenario (checklist)
◦ Bias: HTF shows a recent upside BOS or down→up CHoCH; price approaches a credible demand OB/FVG.
◦ Liquidity: recent SSL sweep (downside liquidity taken). Swept SSLs may auto-remove if that option is enabled.
◦ Triggers (one or more):
·· Fading back into a demand OB with support (close holds above the OB top).
·· Reclaim of a bullish FVG (close back above lower/mid line).
·· LTF structural shift (mini CHoCH → BOS).
◦ Invalidation/Risk: stop below OB bottom or sweep low, with an ATR buffer.
◦ Management: scale out near local LTF highs or nearest BSL; secondary targets at opposing FVG/supply OB; trail under LTF swing lows or FVG lower boundary.
• Short scenario (checklist)
◦ Bias: HTF shows a downside BOS or up→down CHoCH.
◦ Liquidity: recent BSL sweep (upside liquidity taken).
◦ Triggers (one or more):
·· Rejection from a supply OB after re-entry.
·· Failure/reject at a bearish FVG (upper/mid line).
·· LTF structural shift (mini CHoCH → downside BOS).
◦ Invalidation/Risk: stop above OB top or sweep high, with an ATR buffer.
◦ Management: scale out near local LTF lows or nearest SSL; secondary targets at opposing FVG/demand OB; trail above LTF swing highs or FVG upper boundary.
BSL/SSL TIPS
• Generation uses recent fractal highs/lows with tick/ATR tolerance and a spacing cap to avoid spurious “equal” prints.
• If auto-removal is enabled, swept lines vanish, keeping the view focused on what matters now.
• Confluence after a sweep (e.g., reversal close + OB/FVG nearby) can increase conviction.
ORDER BLOCK TIPS
• Significance filters (body/thickness/leg displacement/optional volume) suppress weak OBs by design.
• De-duplication keeps one meaningful zone when two boxes fully overlap (or extends the older zone to the right, depending on policy).
• Mitigation modes:
◦ Keep — retain the zone for reference even after touch.
◦ Delete — remove on mitigation to keep only fresh levels.
◦ Shrink — reduce boundary toward the fill to reflect partial consumption.
FVG TIPS
• Three-way minimum size (percent / ATR / ticks) must be met; this intentionally removes micro-gaps (e.g., ~0.12%).
• Bullish FVG: reclaim of the lower/mid line with a close may serve as a long trigger in a bullish context.
• Bearish FVG: rejection at the upper/mid line may serve as a short trigger in a bearish context.
• On mitigation (close through), boxes are removed to keep the chart clean.
KILLZONE (SESSION START MARKERS)
• Asia / Europe / New York: a short vertical tick and label at the session’s first bar—no background shading.
• Focus on signals forming soon after the session opens; overlap (e.g., Europe→New York) can increase volatility.
RISK & REAL-TIME CONSIDERATIONS
• Fractal swings confirm after L/R bars, so structure labeling is delayed by definition (and then fixed).
• BOS/CHoCH is validated only on the confirming close (k·ATR beyond the swing with a minimum real-body).
• OB/FVG/BSL-SSL state can change quickly on mitigation/sweep; account for slippage and define re-entry rules ahead of time.
• Always apply independent risk management (position sizing, stops). This is a study/analysis tool only.
READABILITY TIPS
• Use the Force-Black toggle when you want maximum contrast against candles.
• Keep only what you need (e.g., FVG+OB) to avoid visual overload.
• Always re-anchor LTF decisions to HTF zones and structure.
LIMITATIONS & NOTES
• No forward-looking guarantees; filters reduce noise but cannot eliminate false signals.
• Visualizations and thresholds are for study/analysis; not financial advice.
• Invite-Only distribution; access is managed via TradingView’s invitation system. No external links or promotions are included.

SMC Suite – OB • Breaker • Liquidity Sweep • FVGSMC Suite — Order Blocks • Breaker • Liquidity Sweep • FVG
What it does:
Maps institutional SMC structure (OB → Breaker flips, Liquidity Sweeps, and 3-bar FVGs) and alerts when price retests those zones with optional r ejection-wick confirmation .
Why this isn’t “just a mashup”?
This tool implements a specific interaction between four classic SMC concepts instead of only plotting them side-by-side:
1. OB → Breaker Flip (automated): When price invalidates an Order Block (OB), the script converts that zone into a Breaker of opposite bias (bullish ⇄ bearish), extends it, and uses it for retest signals.
2. Liquidity-Gated FVGs : Fair Value Gaps (3-bar imbalances) are optionally gated—they’re only drawn/used if a recent liquidity sweep occurred within a user-defined lookback.
3. Retest Engine with Rejection Filter : Entries are not whenever a zone prints. Signals fire only if price retests the zone, and (optionally) the candle shows a rejection wick ≥ X% of its range.
4. Signal Cooldown : Prevents spam by enforcing a minimum bar gap between consecutive signals.
These behaviors work together to catch the sequence many traders look for: sweep → impulse → OB/FVG → retest + rejection.
Concepts & exact rules
1) Impulsive move and swing structure
• A bar is “ impulsive ” when its range ≥ ATR × Impulsive Mult and it closes in the direction of the move.
• Swings use Pivot Length (lenSwing) on both sides (HH/LL detection). These HH/LLs are also used for sweep checks.
2) Order Blocks (OB)
• Bullish OB : last bearish candle body before an i mpulsive up-move that breaks the prior swing high . Zone = min(open, close) to low of that candle.
• Bearish OB : last bullish candle body before an impulsive down-move that breaks the prior swing low . Zone = high to max(open, close).
• Zones extend right for OB Forward Extend bars.
3) Breaker Blocks (automatic flip)
If price invalidates an OB (closes below a bullish OB’s low or above a bearish OB’s high), that OB flips into a Breaker of opposite bias:
• Invalidated bullish OB → Bearish Breaker (resistance).
• Invalidated bearish OB → Bullish Breaker (support).
Breakers get their own style/opacity and are used for separate Breaker Retest signals.
4) Liquidity Sweeps (decluttered)
• Bullish sweep : price takes prior high but closes back below it.
• Bearish sweep : price takes prior low but closes back above it.
Display can be tiny arrows (default), short non-extending lines, or hidden. Old marks auto-expire to keep the chart clean.
5) Fair Value Gaps (FVG, 3-bar)
• Bearish FVG : high < low and current high < low .
• Bullish FVG : low > high and current low > high .
• Optional gating: only create/use FVGs if a sweep occurred within ‘Recent sweep’ lookback.
6) Retest signals (what actually alerts)
A signal is true when price re-enters a zone and (optionally) the candle shows a rejection wick:
• OB Retest LONG/SHORT — same-direction retest of OB.
• Breaker LONG/SHORT — opposite-direction retest of flipped breaker.
• FVG LONG/SHORT — touch/fill of FVG with rejection.
You can require a wick ratio (e.g., bottom wick ≥ 60% of range for longs; top wick for shorts). A cooldown prevents back-to-back alerts.
How to use
1. Pick timeframe/market : Works on any symbol/TF. Many use 15m–4h intraday and 1D swing.
2. *Tune Pivot Length & Impulsive Mult:
• Smaller = more zones and quicker flips; larger = fewer but stronger.
3. Decide whether to gate FVGs with sweeps : Turn on “Require prior Liquidity Sweep” to focus on post-liquidity setups.
4. Set wick filter : Start with 0.6 (60%) for cleaner signals; lower it if too strict.
5. Style : Use the Style / Zones & Style / Breakers groups to set colors & opacity for OB, Breakers, FVGs.
6. Alerts : Add alerts on any of:
• OB Retest LONG/SHORT
• Breaker LONG/SHORT
• FVG LONG/SHORT
Choose “Once per bar close” to avoid intrabar noise.
Inputs (key)
• Swing Pivot Length — swing sensitivity for HH/LL and sweeps.
• Impulsive Move (ATR ×) — defines the impulse that validates OBs.
• OB/FVG Forward Extend — how long zones project.
• Require prior Liquidity Sweep — gate FVG creation/usage.
• Rejection Wick ≥ % — confirmation filter for retests.
• Signal Cooldown (bars) — throttles repeated alerts.
• Display options for sweep marks — arrows vs short lines vs hidden.
• Full color/opacity controls — independent palettes for OB, Breakers, and FVGs (fills & borders).
What’s original here
• Automatic OB → Breaker conversion with separate retest logic.
• Liquidity-conditioned FVGs (FVGs can be required to follow a recent sweep).
• Unified retest engine with wick-ratio confirmation + cooldown.
• Decluttered liquidity visualization (caps, expiry, and non-extending lines).
• Complete styling controls for zone types (fills & borders), plus matching signal label colors.
🔹 Notes
• This script is invite-only.
• It is designed for educational and discretionary trading use, not as an autotrader.
• No performance guarantees are implied — always test on multiple markets and timeframes.

Quantura - Quantitative AlgorythmIntroduction
“Quantura – Quantitative Algorithm” is an invite-only Pine Script strategy designed for multi-timeframe analysis, combining technical filters with user-adjustable fundamental sentiment. It was primarily developed for cryptocurrency markets but can also be applied across other assets such as Forex, stocks, and indices. The goal is to generate structured trade signals through a confluence of techniques rather than relying on a single indicator.
Originality & Value
Quantura is not a simple mashup of indicators. Its originality comes from how multiple layers of analysis are integrated into a single decision framework . Instead of showing indicators separately, the strategy only issues trades when several conditions align simultaneously:
RSI entry triggers confirm overbought/oversold reversals.
Market structure on a higher timeframe confirms trend direction.
Order block detection highlights zones of concentrated supply and demand.
Premium/Discount zones identify potential over- and undervaluation.
HTF EMA provides trend confirmation.
Optional candlestick patterns strengthen reversal or continuation signals.
An optional correlation filter compares the main asset to a reference instrument.
This design forces agreement between different methodologies (momentum, structure, value, volume, sentiment), which reduces noise compared to using them in isolation.
Functionality & Indicators
Entry trigger: RSI exits from extreme zones.
Filters: Only valid when all selected filters (HTF structure, EMA, order blocks, premium/discount, candlesticks, correlation, volume) confirm the direction.
Fundamental bias: User-defined sentiment and analysis settings (bullish, bearish, neutral) influence whether long or short trades are permitted.
Exits: ATR-based take profit and stop loss, with optional breakeven, opposite-signal exit, and session-end exit.
Visualization: Buy/Sell markers, trend-colored candles, and an optional dashboard summarizing indicator status.
Parameters & Customization
Timeframes: Independent HTF and LTF selection.
Trading direction: Long / Short / Both.
Session and weekday filters.
RSI length and thresholds.
Filters: HTF structure, order blocks, premium/discount, EMA, candlestick, ATR volatility, volume zones, correlation.
Exit rules: ATR multipliers for TP/SL, breakeven logic, session-end exit, opposite-signal exit.
Visuals: Toggle signals, candles, dashboard, custom colors.
Default Properties (Strategy Settings)
Initial Capital: 200,000 USD
Position Size: 1 BTC
Commission: 0.25%
Slippage: enabled (1 tick)
Pyramiding: 0 (one position at a time)
Note: The position sizing of 1 BTC per trade is intentionally set for backtesting demonstration. Most traders prefer to risk 1-5% of equity.
Backtesting & Performance
Backtests on BTCUSD (2 years) with the above defaults showed:
103 trades
Win rate: 42%
Profit factor: 1.3
Maximum drawdown: 10%
These results illustrate how the confluence model behaves, but they are not predictive of future performance . Users should re-test with their own preferred symbols, settings, and timeframes.
Risk Management
ATR-based stops and targets scale with volatility.
Commission and slippage are included by default for realistic modeling.
Opposite-signal exit helps capture trend reversals.
Session-end exit can close intraday positions before illiquid hours.
Breakeven option protects profits when available.
Although the default allocation uses 1 BTC per trade for demonstration, this is not a recommendation. Users are encouraged to adjust risk sizing downwards to sustainable levels (commonly 1-5%).
Limitations & Market Conditions
Performs best in volatile, liquid markets (e.g., crypto).
May struggle in prolonged sideways markets with low volatility.
News events and fundamentals outside user inputs can override signals.
Usage Guide
Add “Quantura – Quantitative Algorithm” to your chart in strategy mode.
Select HTF and LTF timeframes, trading direction, and session filters.
Configure confluence filters (structure, EMA, order blocks, premium/discount, candlestick, correlation, volume).
Set sentiment and analysis bias in fundamental settings.
Adjust ATR multipliers and exits.
Review buy/sell signals and analyze performance in the Strategy Tester.
Author & Access
Developed 100% by Quantura . Distributed as an Invite-Only script . Access is granted upon request. Details are provided in the Author’s Instructions field.
Important: This description complies with TradingView’s Script Publishing Rules and House Rules. It does not guarantee profitability, avoids unrealistic claims, and explains how the strategy integrates multiple methods into a coherent decision framework.

Qabas systemQabas System — Multi-Layered Smart Trading Framework
The Qabas System is an advanced all-in-one Pine Script indicator designed to combine institutional-grade analysis, smart entry/exit detection, and adaptive risk management into a single framework. It integrates multiple professional trading concepts into one ecosystem, making it suitable for intraday, swing, and position trading.
⸻
Core Components
1. VSA Engine (Volume Spread Analysis)
Detects institutional footprints (accumulation, distribution, no-demand, supply tests) by analyzing the relationship between candle spread, volume, and close location.
2. Order Blocks (Supply & Demand Zones)
Automatically highlights bullish and bearish order blocks with customizable transparency, showing where institutions left unfilled orders.
3. Smart Traps (Liquidity Traps)
Identifies bull and bear traps by detecting abnormal wicks and volume exhaustion near highs/lows — a common reversal signal.
4. Fibonacci Golden Levels
Draws adaptive retracement levels (23.6%, 38.2%, 50%, 61.8%, 78.6) aligned with the current market trend.
5. CPR (Central Pivot Range)
Daily pivot zones acting as magnets for price, helping detect high-probability reversal and breakout areas.
6. Liquidity Zones
Detects liquidity sweeps above highs and below lows combined with strong volume confirmation.
7. Market Structure (Chanlun Waves)
Tracks higher-highs / lower-lows to outline bullish or bearish structural waves.
8. Breakout Engine (Duanxian Gate)
Confirms valid breakouts using EMA/Donchian/Linear Regression baselines with ATR and volume filters.
9. Adaptive Resonance Oscillator (ARO)
A proprietary entry/exit system based on Hilbert transform and RSI resonance, plotting BUY/SELL arrows only when conditions are valid and alternating (to avoid duplicate signals).
⸻
Risk & Trade Management
• Smart ATR / Fibonacci / Structure-based stop loss options.
• Fibonacci / Risk-Reward / Structure-based take profit logic.
• Built-in auto-risk engine with position sizing (% risk per trade).
• ATR-based adaptive targets for breakout scenarios.
⸻
Visualization & Dashboard
• Multiple color themes (Neon, Professional, Matrix, Gold).
• Smart candle coloring for volume spikes and weak drops.
• Order Block boxes with custom transparency.
• A dynamic Arabic/RTL dashboard showing:
• Decision (Buy/Sell/Strong Buy/Strong Sell/Wait)
• Trend strength (across multiple timeframes)
• Volume pressure (Accumulation / Distribution / Neutral)
• Range & Breakout probabilities
⸻
Dynamic Probabilities Engine
The system records historical outcomes near supply/demand boundaries and continuously adapts breakout probability calculations. This enables it to dynamically project probability of ranging vs breaking out, and update targets accordingly.
⸻
How It Works (Step-by-Step)
1. Market Context: Multi-timeframe EMAs define overall trend score.
2. Institutional Clues: VSA, order blocks, traps, CPR, liquidity, and Fibonacci generate signals.
3. Structural Confirmation: Breakouts and wave analysis validate directional bias.
4. Decision Engine: Weighted scoring system fuses all signals into a single decision (BUY / SELL / WAIT) with confidence level.
5. Execution: ARO entry/exit signals provide precise timing inside the broader context.
6. Risk Management: Adaptive stop loss and take profit methods are applied automatically.
⸻
👉 In summary:
The Qabas System acts like an institutional trading toolkit inside one indicator — combining price action, smart volume, liquidity, structure, and adaptive risk to deliver context-aware, probability-driven trade signals with a clear visual dashboard.

ICT OTE (Optimal Trade Entry) IndicatorWhat This Indicator Does:
This is an ultra-clean ICT (Inner Circle Trader) indicator that shows only ONE high-probability signal at a time when multiple confluences perfectly align. It eliminates chart clutter and focuses on the absolute best trading opportunities.
How It Takes Positions:
🔍 Signal Requirements (ALL Must Align):
Market Structure Break - Significant swing high/low break with volume confirmation
Fair Value Gap (FVG) - Large price imbalance/gap (minimum 0.5% size)
Order Block - Institutional supply/demand zone from recent rejection candle
OTE Sweet Spot - Price retraces to 70.5% Fibonacci level (optimal entry zone)
Volume Confirmation - 50% above 50-bar average volume
Rejection Candle - Proper candle formation showing rejection at the level
📊 Position Entry Logic:
BUY Signal Triggers When:
Price breaks above a significant swing high (bullish structure break)
Price retraces back down into a Fair Value Gap or Order Block
Retracement reaches exactly the 70.5% optimal level
Volume spike confirms institutional interest
Rejection candle forms (closes higher than it opened during retracement)
No other signal has been active in the last 50 bars (cooldown system)
SELL Signal Triggers When:
Price breaks below a significant swing low (bearish structure break)
Price retraces back up into a Fair Value Gap or Order Block
Retracement reaches exactly the 70.5% optimal level
Volume spike confirms institutional interest
Rejection candle forms (closes lower than it opened during retracement)
No other signal has been active in the last 50 bars (cooldown system)
⚡ Key Features:
Ultra-Strict Filtering: Only 2-4 signals per month on average (quality over quantity)
One Signal Rule: Only one active signal at a time - no confusion
50-Bar Cooldown: Prevents signal spam and overtrading
Perfect Confluence: Requires 3+ ICT concepts to align simultaneously
Clean Chart: No boxes, lines, or visual clutter - just clear BUY/SELL labels
🎯 Trading Strategy:
Wait for Signal: Large BUY or SELL label appears on chart
Entry: Enter immediately when signal appears (all confluences already confirmed)
Stop Loss: Place beyond the Fair Value Gap or Order Block (typically 1-2% risk)
Take Profit: Target previous swing high/low or major liquidity levels
Risk Management: Only trade when signal appears - no guessing or early entries
💡 Why It Works:
This indicator combines ICT's most powerful concepts (market structure, FVGs, order blocks, optimal retracements) into one confluence-based system. It only signals when institutional money is likely moving, giving you the highest probability entries with minimal noise.
Perfect for: Swing traders, day traders, and anyone wanting clean, high-probability ICT signals without chart clutter.
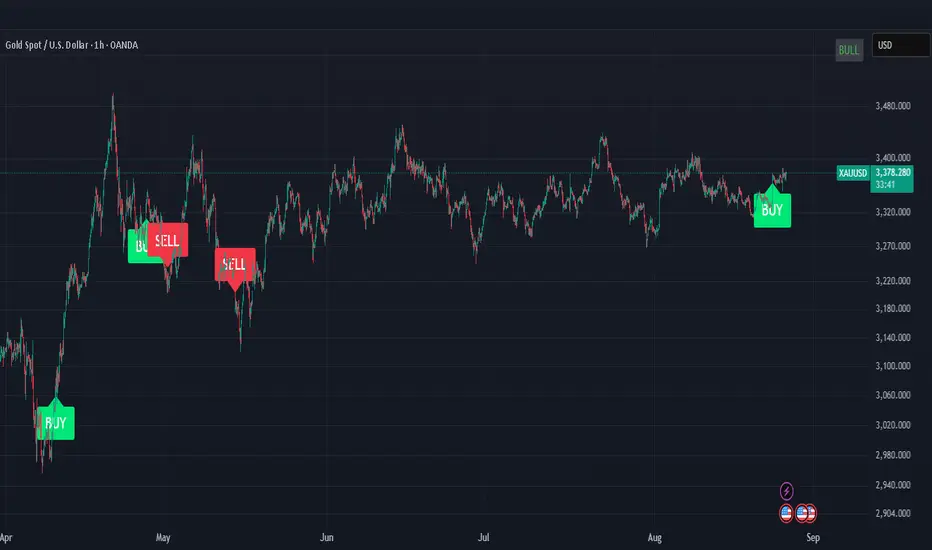
Pro Trading White Crow### English Description (For TradingView Publication)
**Timeframes:** All (Optimal: M15-H4)
**Markets:** Forex, Cryptocurrencies, Stocks
**Unique Value Proposition:**
The White Crow system combines institutional trading concepts with retail-friendly signals. Its patented triple-filtering methodology detects:
1. Smart Money accumulation zones (Order Blocks)
2. Market structure shifts (Pivot Points)
3. Momentum clusters (CCI/RSI convergence)
**Key Features:**
✅ **4 Professional Signals:**
- `Buy`: Standard long entry
- `Buy X`: Strong accumulation signal
- `Close`: Standard exit signal
- `CloseV`: Urgent liquidation signal
✅ **Institutional Tools:**
- Order Block detection
- Adaptive pivot points
- Cluster momentum analysis
✅ **Advanced Filters:**
- RSI divergence filter
- Time-based signal suppression
- Volatility-adjusted thresholds
**Optimal Settings:**
| Market | Period | Sigma | Order Block Multiplier |
|--------------|------------|--------|------------------------|
| Forex | 5 | 0.036 | 1.5 |
| Crypto | 3 | 0.050 | 2.0 |
| Stocks | 8 | 0.025 | 1.2 |
**Usage Guide:**
1. **Identify Bias:**
- Bullish: Consecutive higher pivots
- Bearish: Consecutive lower pivots
2. **Entry Rules:**
```pine
Enter Long when:
+ +
```
3. **Exit Rules:**
```pine
Exit when:
OR
```
4. **Risk Management:**
- Stop Loss: Recent pivot low
- Position Size: 1-2% account risk
**Risk Disclosure:**
⚠️ Trading involves significant capital risk. This indicator:
- May produce false signals during news events
- Requires confirmation on higher timeframes
- Should be tested in demo accounts first
- Is not financial advice (educational purpose only)
**Why "White Crow"?**
In market psychology, a white crow represents an exceptional opportunity that contradicts normal market behavior - exactly what this system detects through its unique convergence of institutional flow analysis and technical signals.
---
### Описание на русском (Для публикации на TradingView)
**Таймфреймы:** Все (оптимально: M15-H4)
**Рынки:** Форекс, Крипта, Акции
Институциональные концепции с понятными сигналами. Методика тройной фильтрации обнаруживает:
1. Зоны накопления "умных денег" (Блоки ордеров)
2. Смены рыночной структуры (Пивотные точки)
3. Кластеры импульса (конвергенция CCI/RSI)
**Ключевые особенности:**
✅ **4 Профессиональных сигнала:**
- `Buy`: Стандартный вход в лонг
- `Buy X`: Сигнал сильного накопления
- `Close`: Стандартный сигнал выхода
- `CloseV`: Срочный сигнал ликвидации
✅ **Институциональные инструменты:**
- Обнаружение блоков ордеров
- Адаптивные пивотные точки
- Анализ кластеров импульса
✅ **Продвинутые фильтры:**
- Фильтр дивергенции RSI
- Временное подавление сигналов
- Пороги с учётом волатильности
**Оптимальные настройки:**
| Рынок | Период | Сигма | Множитель блоков ордеров |
|--------------|------------|----------|--------------------------|
| Форекс | 5 | 0.036 | 1.5 |
| Крипта | 3 | 0.050 | 2.0 |
| Акции | 8 | 0.025 | 1.2 |
**Инструкция по применению:**
1. **Определение тренда:**
- Бычий: Последовательные более высокие пивоты
- Медвежий: Последовательные более низкие пивоты
2. **Правила входа:**
```pine
Вход в лонг при:
+ +
```
3. **Правила выхода:**
```pine
Выход при:
ИЛИ
```
4. **Управление рисками:**
- Стоп-лосс: Последний пивотный минимум
- Размер позиции: 1-2% риска на сделку
**Предупреждение о рисках:**
⚠️ Торговля связана со значительным риском потери капитала. Индикатор:
- Может давать ложные сигналы во время новостей
- Требует подтверждения на старших таймфреймах
- Необходимо тестировать на демо-счетах
- Не является финансовой рекомендацией (только обучение)
**Почему "White Crow"?**
В рыночной психологии белая ворона символизирует исключительную возможность, противоречащую нормальному поведению рынка - именно это обнаруживает система через уникальное сочетание анализа институционального потока и технических сигналов.

smc bullrider 1.0The smc bullrider 1.0 indicator is specifically crafted for mapping market structures. It excels in clearly recognizing type of Points Of Interest (SCOB) offering traders a straightforward and effective method to analyze market movements. It helps identify strategic entry points with precision.
🟠 Exploring Structure Mapping.
🔹This indicator presents a distinctive method for examining the market structure, emphasizing liquidity through the concept of 'Inducement'. Inducement plays a pivotal role in pinpointing essential structural indicators in the market, including Higher Highs (HH), Higher Lows (HL), Lower Lows (LL), and Lower Highs (LH).
🔹Consider Inducement as a strategically placed trap near supply or demand zones. It lures in eager buyers or sellers before the actual zone is reached, effectively creating liquidity. To validate an inducement, it must signify a legitimate pullback.
🔹A valid scenario arises when the price either sweeps or closes beyond the high or low of the preceding candle. In this context, the candle's color, whether bullish or bearish, holds no significance, and both situations are deemed valid. Inside bars are disregarded unless they meet this specific criterion. The indicator facilitates this process by automatically highlighting valid pullbacks with a distinctive gray round label.
🔹This feature serves not only as a visual guide but also as a vital tool for effortlessly comprehending market movements, offering a clear and visual representation of ongoing market trends
🟣 Understanding POI Functionality
🔹Single Candle Order Block (SCOB): Leveraging single-candle mitigation proves to be a powerful method for incorporating multiple entries into your successful trades.
🔵 How to Utilize the smc bullrider 1.0 Indicator:
🔹The smc bullrider 1.0 Indicator is crafted to elevate your trading strategy by pinpointing crucial order blocks and market signals. Below is a guide on how to make the most of the different components of the smc bullrider 1.0 Indicator:
🔹SCOB (Single Candle Order Block):
Application: SCOB is well-suited for scaling into a position. It is best utilized to increase positions when the market responds to OB or OB-EXT, signaling a potential reversal.
🟢Here's how to use it.
🔹Market Structure Drawing
This diagram depicts significant market indicators, such as instances of ascending prices (Higher Highs - HH) or descending prices (Lower Lows - LL). It serves as a valuable visual tool for comprehending the dynamics of market behavior
PICTURE (DIAGRAM)
Live Chart Example: Our indicator efficiently dissects market structure, showcasing the 'Inducement' concept with precision in real-time trends—highlighting HH, HL, LL, and LH
PICTURE (REAL CHART)
Valid Pullback ( IDM ):
Valid Pullback Example: This image illustrates a common situation where the price extends beyond the high or low of the preceding candle, signifying a valid pullback. Pay attention to the identifiable gray dotted line label marking the inducement point.
PICTURE (DRAW/REAL)
Single Candle Order Block (SCOB)
The provided chart showcases the SCOB in a real trading setting, highlighting its effectiveness in optimizing trades.
🟡 Summary
🔹smc bullrider 1.0 Indicator distinguishes itself in the realm of market analysis, with a distinct focus on structure mapping and high-probability Point of Interest (POI).
Furthermore, it provides a visual representation of three key areas for each market move: discount, premium, and the equilibrium area at 50%. Its innovative approach involves scrutinizing market structure using the 'Inducement' concept, a pivotal strategy for identifying vital structural markers and steering